Metro Vancouver homes sales down across all property types
Home buyer demand remains below long-term historical averages in the Metro Vancouver housing market.
The Real Estate Board of Greater Vancouver (REBGV) reports that residential home sales totalled 1,608 in the region in November 2018, a 42.5 per cent decrease from the 2,795 sales recorded in November 2017, and an 18.2 per cent decrease compared to October 2018 when 1,966 homes sold.
Last month’s sales were 34.7 per cent below the 10-year November sales average and was the lowest sales for the month since 2008.
“Home buyers have been taking a wait-and-see approach for most of 2018. This has allowed the number of homes available for sale in the region to return to more typical historical levels,” Phil Moore, REBGV president said. “This activity is helping home prices edge down, across all property types, from the record highs we’ve experienced over the last year.”
There were 3,461 detached, attached and apartment homes newly listed for sale on the Multiple Listing Service® (MLS®) in Metro Vancouver in November 2018. This represents a 15.8 per cent decrease compared to the 4,109 homes listed in November 2017 and a 29 per cent decrease compared to October 2018 when 4,873 homes were listed.
The total number of homes currently listed for sale on the MLS® system in Metro Vancouver is 12,307, a 40.7 per cent increase compared to November 2017 (8,747) and a 5.2 per cent decrease compared to October 2018 (12,984).
For all property types, the sales-to-active listings ratio for November 2018 is 13.1 per cent. By property type, the ratio is 8.9 per cent for detached homes, 14.7 per cent for townhomes, and 17.6 per cent for apartments.
Generally, analysts say that downward pressure on home prices occurs when the ratio dips below the 12 per cent mark for a sustained period, while home prices often experience upward pressure when it surpasses 20 per cent over several months.
“Home prices have declined between four and seven per cent over the last six months depending on property type. We’ll watch conditions in the first quarter of 2019 to see if home buyer demand picks up ahead of the traditionally more active spring market,“ Moore said.
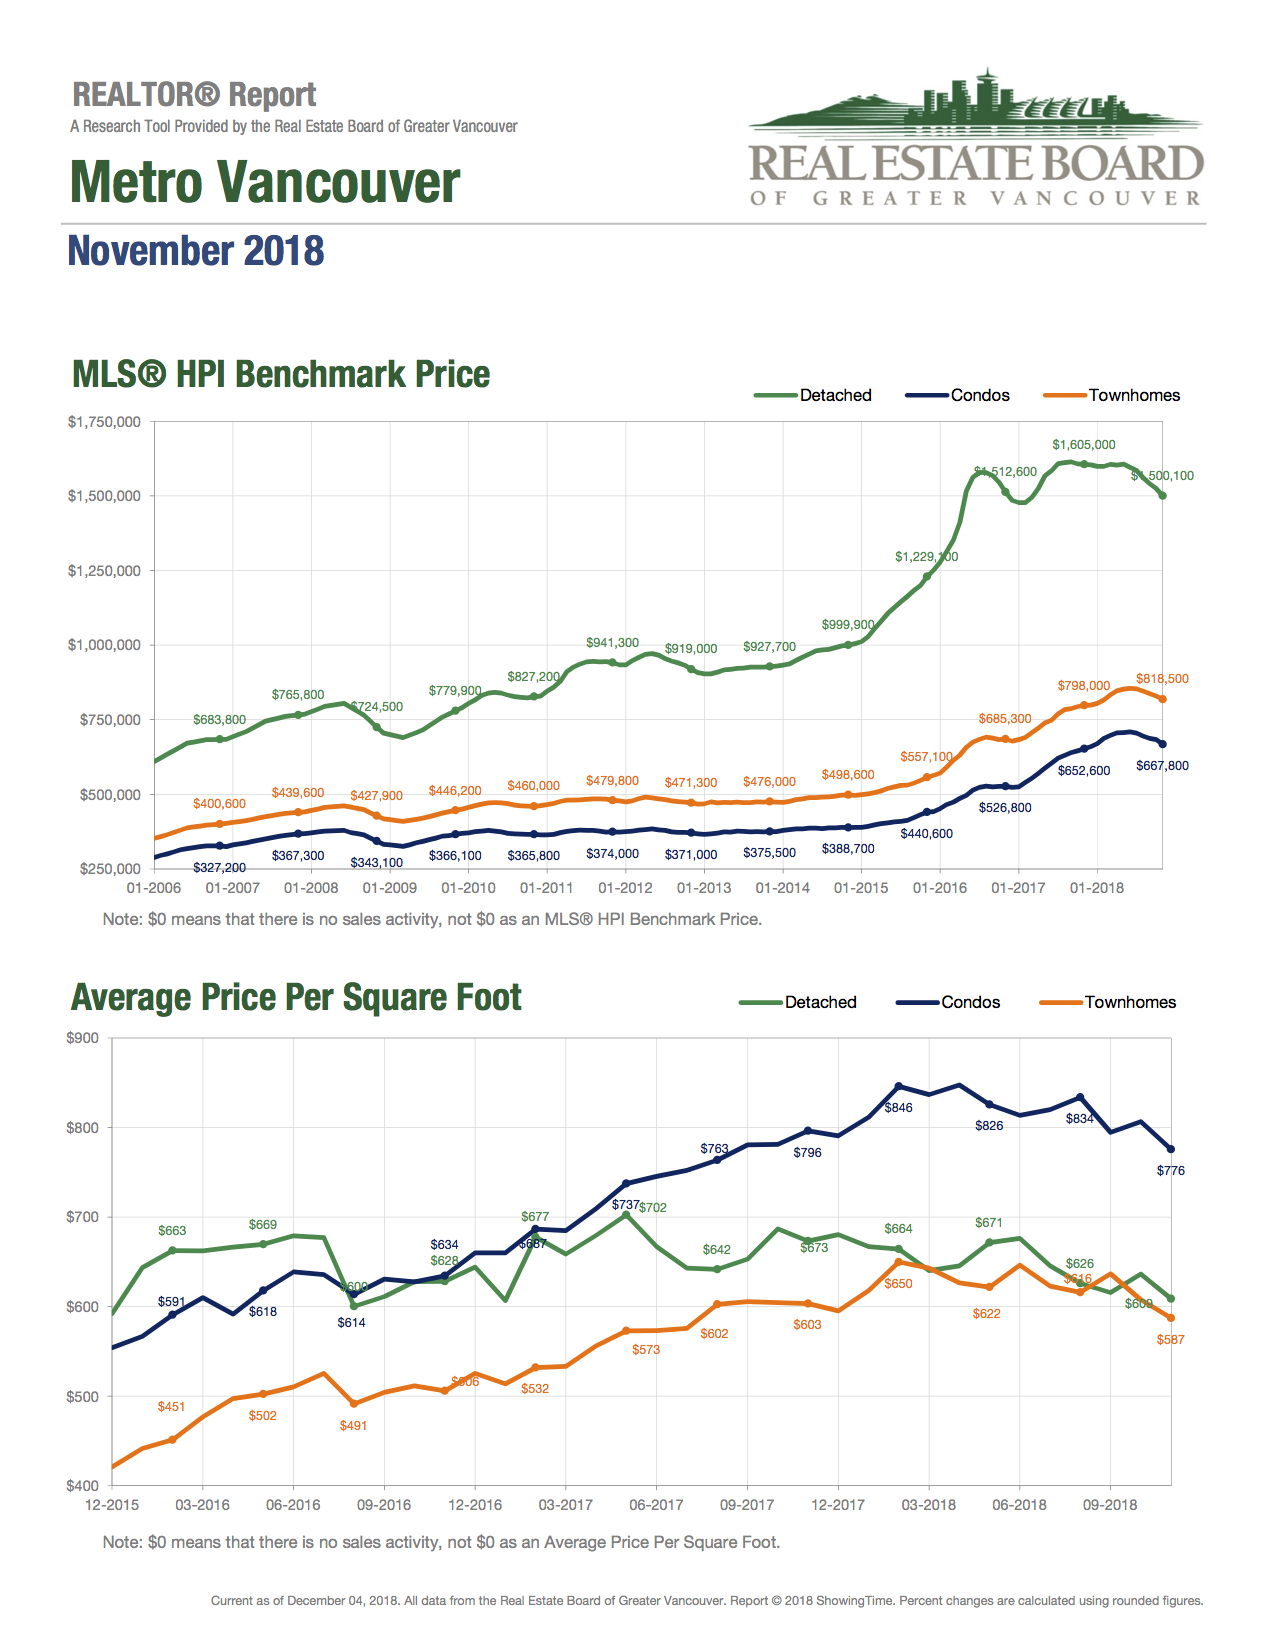
The MLS® Home Price Index composite benchmark price for all residential properties in Metro Vancouver is currently $1,042,100. This represents a 1.4 per cent decrease over November 2017 and a 1.9 per cent decrease compared to October 2018.
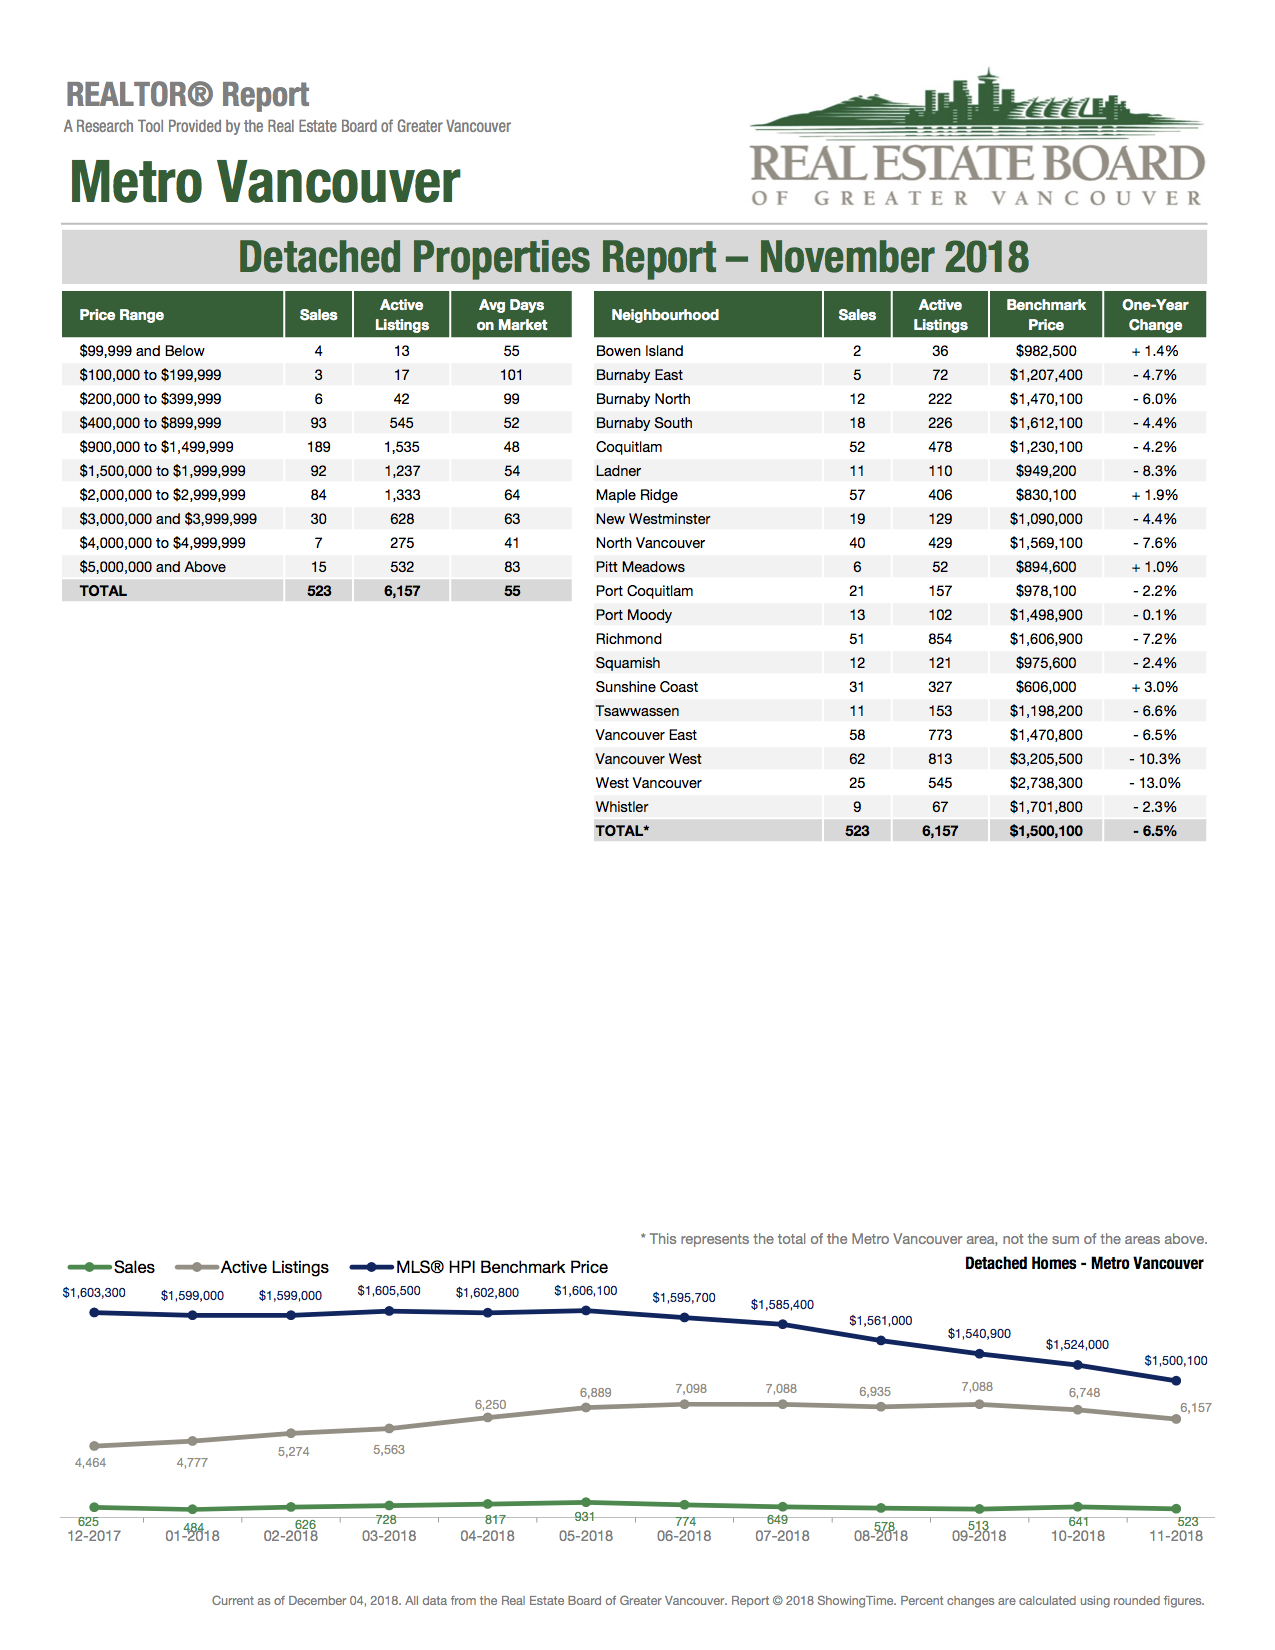
Detached home sales in November 2018 reached 516, a 38.6 per cent decrease from the 841 detached sales recorded in November 2017. The benchmark price for detached homes is $1,500,100. This represents a 6.5 per cent decrease from November 2017 and a 1.6 per cent decrease compared to October 2018.
Apartment home sales reached 810 in November 2018, a 46.3 per cent decrease compared to the 1,508 sales in November 2017. The benchmark price of an apartment property is $667,800. This represents a 2.3 per cent increase from November 2017 and a 2.3 per cent decrease compared to October 2018.
Attached home sales in November 2018 totalled 282, a 36.8 per cent decrease compared to the 446 sales in November 2017. The benchmark price of an attached home is $818,500. This represents a 2.6 per cent increase from November 2017 and a 1.3 per cent decrease compared to October 2018.
Click here to download the full package.
|


