RSS


Haft-Sin or Haft-Chin?

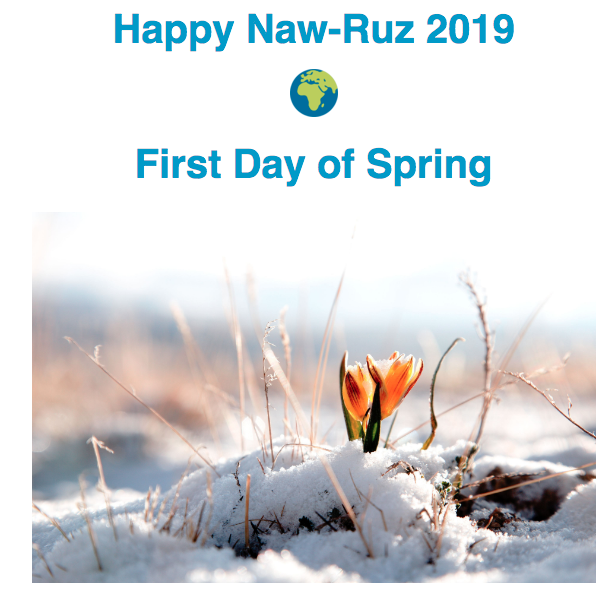
With the first day of Spring, the thirteen day Festival called Sizdah Bedar beginsIt is also known as Nature's Day and is celebrated by spending time outdoors and enjoying Nature with family and friends. In our ad this week in Daneshmand Magazine, we posted a touching story about how the famous Persian nuclear physicist, Dr. Mahmoud Hesabi, explains the meaning of Naw-Ruz and the Haft-Sin to Albert Einstein and other professors at his Naw-Ruz celebration. The Haft-Sin is a traditional way of commemorating the New Year, by decoratively placing seven items on a table that begin with the letter "seen" in the Persian alphabet. However, according to Dr. Hesabi, the Haft-Sin used to be called Haft-Chin, which actually means "picking" or"harvesting", and each symbolic item has a spiritual meaning associated with it.

These items of the Haft-Chin and their meanings are:
 
1. Sabzeh (sprouts), representing growth.
2. Mahi (goldfish), representing movement.
3. Ayneh (mirror), representing sincerity, to be oneself, not being two faced.
4. Sham (candle), representing birth and death. For each guest that is present at the celebration, a candle is lit. While we may approximately know when one is to be born, we do not know ones death. It's destiny.
5. Niloofar (Lotus flower), the Lotus flower comes out from the dirt of the pond, yet it blooms in outmost purity. This represents the purity of the transformation that takes place in the human spirit, from materialism to the higher self.
6. Moose ghee Irani (classical Persian music). It is more than just music, it uplifts the spirit and speaks from the heart. Iis a kind of philosophy, a way of thinking, an expression of hope and desire.
7. A bowl of water with an orange floating inside of it, representing the Earth in Space.

Einstein was the most surprised about this last point, when Dr. Hesabi explained that this visualization was present from 10,000 years ago, meaning that the civilizations at the time already knew that the Earth was round.

Reference: https://welcometoiran.com/mahmoud-hesabi/

Read

banner
 

The Metro Vancouver housing market saw increased supply from home sellers and below average demand from home buyers in February.

The Real Estate Board of Greater Vancouver (REBGV) reports that residential home sales in the region totalled 1,484 in February 2019, a 32.8 per cent decrease from the 2,207 sales recorded in February 2018, and a 34.5 per cent increase from the 1,103 homes sold in January 2019.

Last month’s sales were 42.5 per cent below the 10-year February sales average.

“For much of the past four years, we’ve been in a sellers’ market. Conditions have shifted over the last 12 months to favour buyers, particularly in the detached home market,” Phil Moore, REBGV president said. “This means that home buyers face less competition today, have more selection to choose from and more time to make their decisions.”

There were 3,892 detached, attached and apartment properties newly listed for sale on the Multiple Listing Service® (MLS®) in Metro Vancouver in February 2019. This represents a 7.8 per cent decrease compared to the 4,223 homes listed in February 2018 and a 19.7 per cent decrease compared to the 4,848 homes listed in January 2019.

The total number of homes currently listed for sale on the MLS® system in Metro Vancouver is 11,590, a 48.2 per cent increase compared to February 2018 (7,822) and a 7.2 per cent increase compared to January 2019 (10,808).

For all property types, the sales-to-active listings ratio for February 2019 is 12.8 per cent.

Generally, analysts say that downward pressure on home prices occurs when the ratio dips below the 12 per cent mark for a sustained period, while home prices often experience upward pressure when it surpasses 20 per cent over several months.

“Homes priced well for today’s market are attracting interest, however, buyers are choosing to take a wait-and-see approach for the time being,” Moore said. “REALTORS® continue to experience more traffic at open houses. We’ll see if this trend leads to increased sales activity during the spring market.”

The MLS® Home Price Index composite benchmark price for all residential properties in Metro Vancouver is currently $1,016,600. This represents a 6.1 per cent decrease over February 2018, a 6.2 per cent decrease over the past six months, and a 0.3 per cent decrease compared to January 2019.

Sales of detached homes in February 2019 reached 448, a 27.9 per decrease cent from the 621 detached sales recorded in February 2018. The benchmark price for detached properties is $1,443,100. This represents a 9.7 per cent decrease from February 2018, a 7.6 per cent decrease over the past six months, and a 0.7 per cent decrease compared to January 2019.

Sales of apartment homes reached 759 in February 2019, a 35.9 per cent decrease compared to the 1,185 sales in February 2018. The benchmark price of an apartment property is $660,300. This represents a four per cent decrease from February 2018, a 5.1 per cent decrease over the past six months, and a 0.3 per cent increase compared to January 2019.

Attached home sales in February 2019 totalled 277, a 30.9 per cent decrease compared to the 401 sales in February 2018. The benchmark price of an attached unit is $789,300. This represents a 3.3 per cent decrease from February 2018, a 6.7 per cent decrease over the past six months, and a 1.4 per cent decrease compared to January 2019.

Download the February 2019 stats package.

Read
Reciprocity Logo The data relating to real estate on this website comes in part from the MLS® Reciprocity program of either the Greater Vancouver REALTORS® (GVR), the Fraser Valley Real Estate Board (FVREB) or the Chilliwack and District Real Estate Board (CADREB). Real estate listings held by participating real estate firms are marked with the MLS® logo and detailed information about the listing includes the name of the listing agent. This representation is based in whole or part on data generated by either the GVR, the FVREB or the CADREB which assumes no responsibility for its accuracy. The materials contained on this page may not be reproduced without the express written consent of either the GVR, the FVREB or the CADREB.